Laravel Telescope is an incredible debugging assistant designed by the Laravel team to help developers gain deep insights into their applications. Whether you’re tracking requests, monitoring database queries, debugging jobs, or analyzing exceptions, Telescope provides a sleek, real-time dashboard to streamline your development workflow.
In this tutorial, I’ll walk you through the simple steps to install and configure Laravel Telescope in your Laravel 12 application. By the end, you’ll have a fully functional Telescope dashboard to supercharge your debugging process.
What is Laravel Telescope?
Laravel Telescope is a powerful debugging tool that offers:
- Real-time monitoring of requests, queries, jobs, exceptions, and logs.
- A clean, intuitive web interface to inspect application activity.
- Customizable watchers to track specific aspects of your app.
- Enhanced debugging capabilities during development.
Telescope is especially useful for spotting performance bottlenecks, debugging failed jobs, and analyzing application behavior.
Step-by-Step Installation Guide
1. Install the Telescope Package
First, install Telescope via Composer. You can install it as a development dependency (recommended for local environments) or as a standard package.
composer require laravel/telescope --dev2. Run the Telescope Installation Command
Next, install Telescope’s assets and configuration files:
php artisan telescope:installThis command will:
- Publish Telescope’s configuration file (config/telescope.php).
- Generate database migrations for Telescope’s tables.
3. Run Migrations
Now, execute the migrations to create Telescope’s required tables:
php artisan migrate4. Serve Your Application & Access Telescope
Start your Laravel development server:
php artisan serveThen, open your browser and navigate to:
http://localhost:8000/telescope/requestsYou should now see the Telescope dashboard, ready to monitor your application!
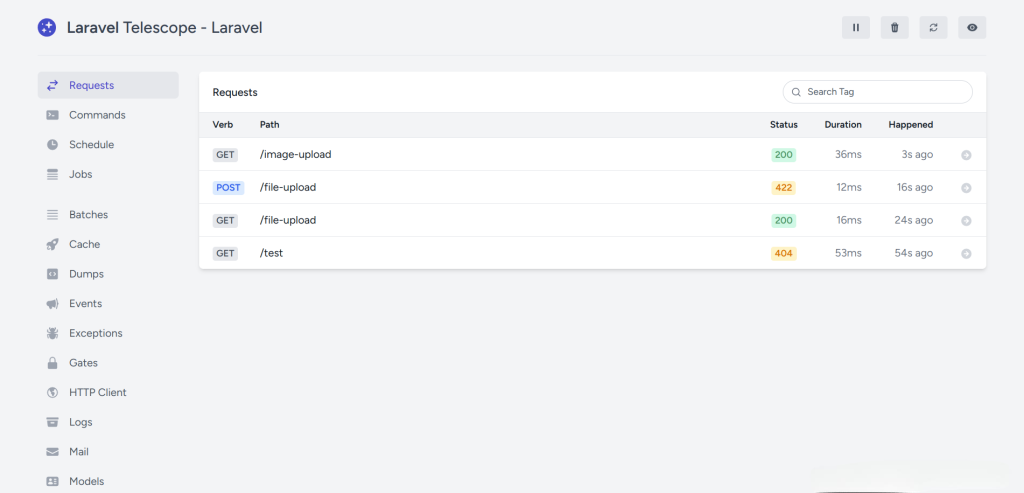
Key Features of Laravel Telescope
Telescope provides a wide range of monitoring tools, including:
- Requests – Track incoming HTTP requests and responses.
- Commands – Monitor Artisan command execution.
- Scheduled Tasks – Inspect scheduled job runs.
- Jobs – Debug queued jobs in real time.
- Cache Operations – View cache hits and misses.
- Exceptions – Analyze thrown exceptions and stack traces.
- Database Queries – Monitor SQL queries for optimization.
- Mail & Notifications – Preview sent emails and notifications.
- Redis Commands – Track Redis interactions.
Final Thoughts
Laravel Telescope is an indispensable tool for Laravel developers, offering unparalleled visibility into application behavior. By following these simple steps, you can integrate Telescope into your Laravel 12 project and start debugging more efficiently.
Have you tried Telescope before? What’s your favorite feature? Let me know in the comments!