Debugging is a fundamental skill in software development. This reading covers the core concepts of debugging, including common error types, essential tools, and strategies for efficiently identifying and resolving issues in code.
The Importance of Debugging
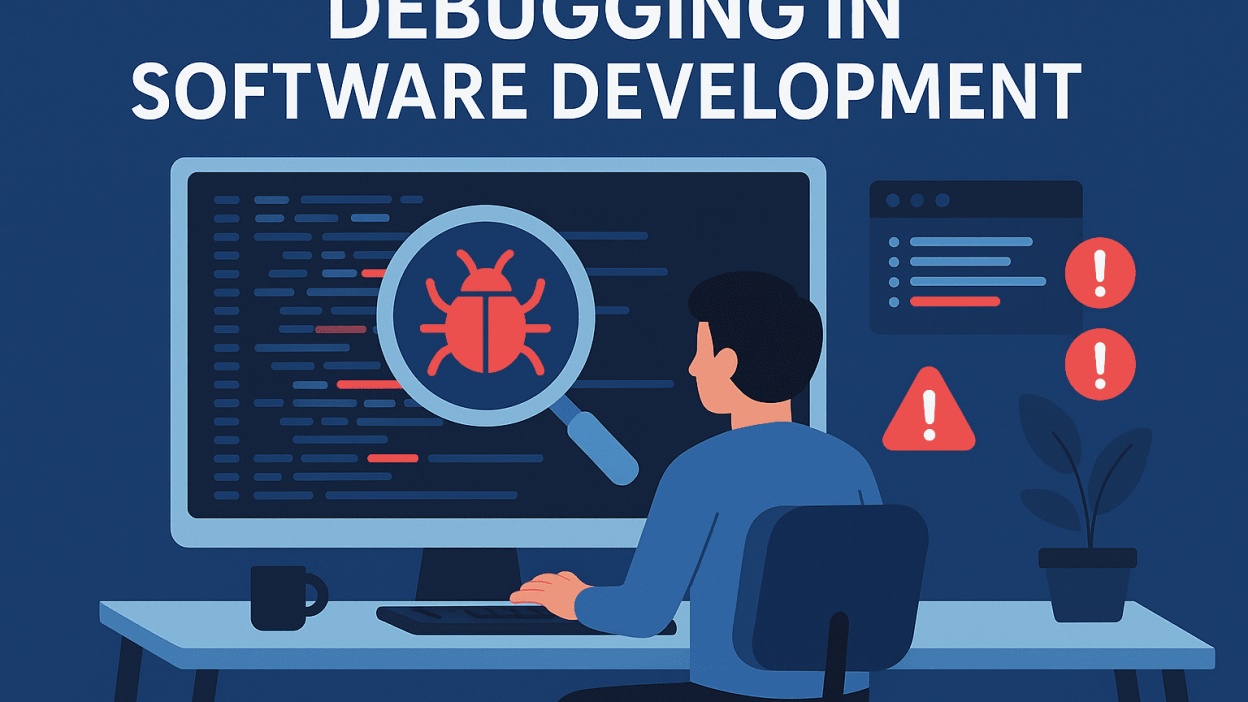
Debugging involves locating and fixing errors (or “bugs”) in a program. It is a crucial skill for developers, ensuring that software runs correctly and efficiently. Beyond simply correcting mistakes, debugging helps developers understand why errors occur, leading to higher-quality, more reliable code.
Common Types of Programming Errors
Developers encounter several types of errors, each requiring a different debugging approach:
- Syntax Errors
- Occur when code violates language rules (e.g., missing semicolons, mismatched brackets).
- Typically caught by the compiler, making them easier to identify.
- Runtime Errors
- Occur during program execution, often causing crashes or unexpected behavior.
- Example: Division by zero or accessing a null reference.
- Logical Errors
- Mistakes in program logic that produce incorrect results without crashing.
- Example: Using the wrong formula in a calculation.
- Often the most challenging to detect since the program runs without obvious failures.
Essential Debugging Techniques
To efficiently diagnose and fix errors, developers use several key techniques:
- Breakpoints – Pause program execution at specific lines to inspect the program’s state.
- Variable Inspection – Check variable values at different execution points to verify data manipulation.
- Stepping Through Code – Execute code line by line to observe behavior and identify errors.
- Error Logging & Debug Messages – Insert log statements to track execution flow and detect unexpected behavior.
Leveraging Debugging Tools
A powerful tool for debugging is the Visual Studio Code Debugger, widely used by developers. It offers features such as:
- Setting breakpoints
- Inspecting variables in real-time
- Stepping through code (step into, over, and out)
How to Use the Visual Studio Code Debugger
- Set Breakpoints – Click next to the line number where you want execution to pause.
- Run in Debug Mode – Start debugging to pause at breakpoints.
- Step Through Code – Execute code line by line to analyze behavior.
- Inspect Variables – Check current values in the debugger’s variables panel.
These features make Visual Studio Code an efficient tool for quickly diagnosing and resolving issues.
Conclusion
Mastering debugging techniques is essential for developers to enhance problem-solving skills and improve software reliability. By leveraging tools like the Visual Studio Code debugger and applying systematic debugging strategies, developers can efficiently identify and fix errors, resulting in more robust and maintainable code.


